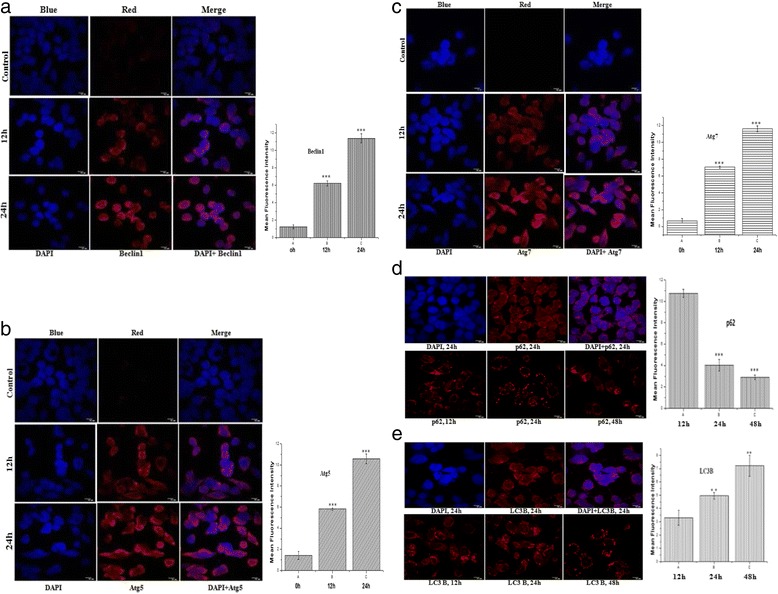
Fig. 11.

Timecourse analysis of different autophagic proteins expression with immunostaining. Representative Confocal Laser Scanning Microscopy (CLSM) images showing HT-29 cells were treated with 2c for autophagic component like Beclin-1(12 and 24 h), Atg-5(12 and 24 h), Atg-7(12 and 24 h), p62(12, 24, 48 h) and LC3B(12, 24, 48 h) fixed and stained with respective fluorescent tagged secondary antibody of (a)Beclin1 (red), (b) Atg5 (red), (c) Atg7 (red), (d) p62 (red) (e) LC3B (red) and counter stained with DAPI (blue). Graphs depict quantification of intensity of Beclin1, Atg5, Atg7, LC3B and p62 expression level respectively in HT-29 cells at indicated time points after 2c incubation. Values are expressed as Mean Fluorescence Intensity ± SEM of three independent experiments (**p <0.01, ***p <0.001). Scale bars, 10 mm
