Fig. 2.

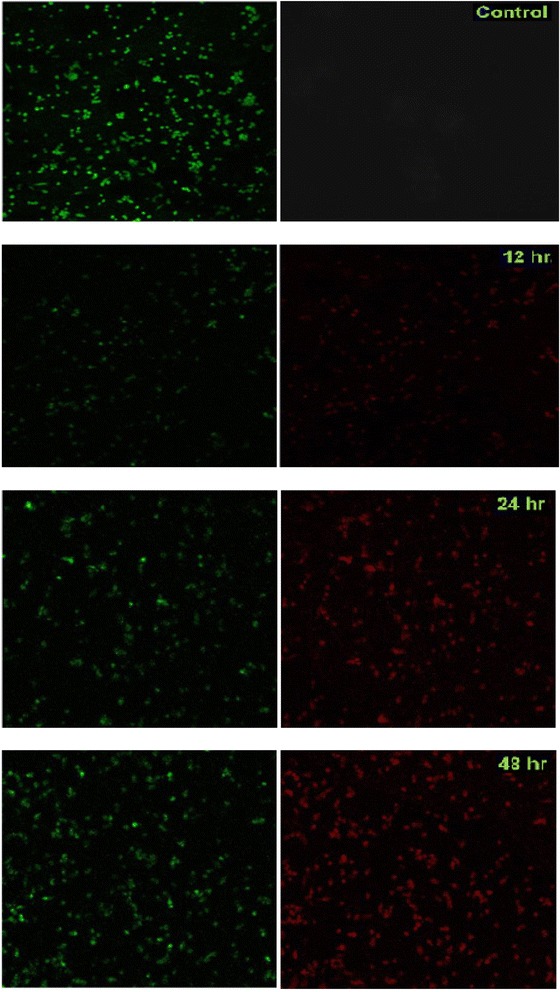
Formation of AVO. Control and 2c (14.9 μM; 0–48 h) treated HT-29 cells (2.5 × 10⁵/ml) were stained with acridine orange (1 μg/ml) for 15 min and AVO formation was measured using fluorescence microscope (60×)

Formation of AVO. Control and 2c (14.9 μM; 0–48 h) treated HT-29 cells (2.5 × 10⁵/ml) were stained with acridine orange (1 μg/ml) for 15 min and AVO formation was measured using fluorescence microscope (60×)