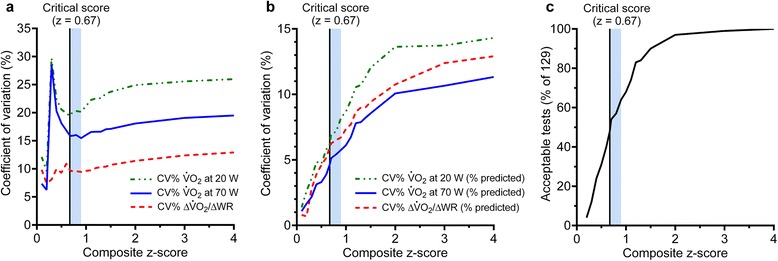
Fig. 2.

Effect of z = 0.67 cut-off on the CV and number of accepted CPETs. a Coefficient of variation (CV) of the absolute oxygen uptake (V̇O2) at 20 W, 70 W, and the increase in V̇O2 per W (∆V̇O2/∆WR), at different z-scores. b CV of % predicted V̇O2 at 20 W, 70 W, and ∆V̇O2/∆WR, at different z-scores. c % of acceptable tests (n = 129), at different z-scores. The shaded area is the approximate range of z-scores (0.67 to 0.9) over which absolute measurement CV was minimized (based on panel a, and transposed into panels b and c). The critical z-score is the minimum value for which all measurements are normally distributed. It is noted that the absolute CV (panel a) depends on both variability in measurements and differences in weight of individuals performing the biological quality control tests (absolute V̇O2 at 20 W and 70 W treadmill walking is dependent on weight). Weight of individuals did not significantly vary during the trial. Despite this, the absolute CV is useful to isolate the z-score range at which the minimum CV occurred (shaded bar). The variability due to measurement differences among centers is better assessed using % predicted values (panel b)
