
Fig. 2.
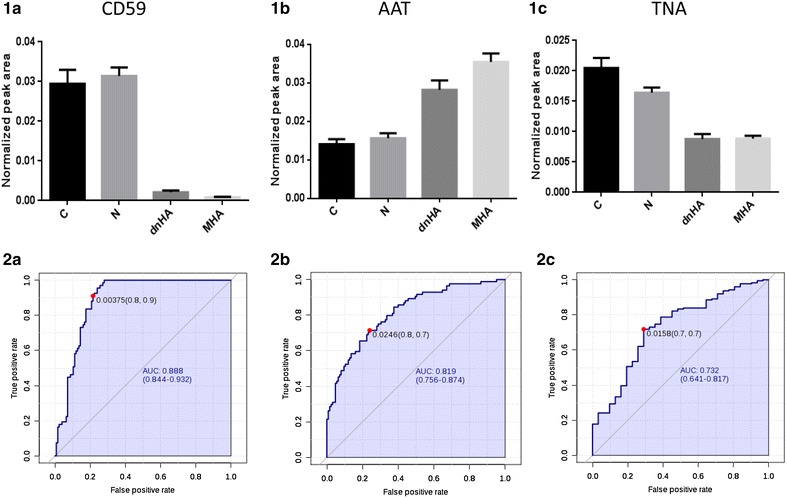
CD59 (1a, 2a), AAT (1b, 2b) and TNA (1c, 2c) urinary response in healthy and hypertensive patients chronically RAS suppressed at different stages of albuminuria progression. Graphs show normalized peak area from SRM-LC-MS/MS data. ROC curves evaluate response to albuminuria condition (CD59 and AAT) or hypertension (TNA)