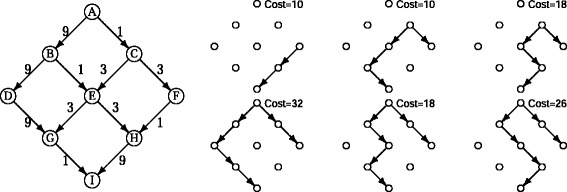
Fig. 1.

Simple representation of the notion of explanation. Left: A TRN representing 12 TF/BS affinity interactions between 9 genes. Costs 1, 3, and 9 are associated according to their p-values (k=3, r=3). Right: Six possible explanations for a co-expressed pair (F,I); two of them are optimal explanations (cost =10)
