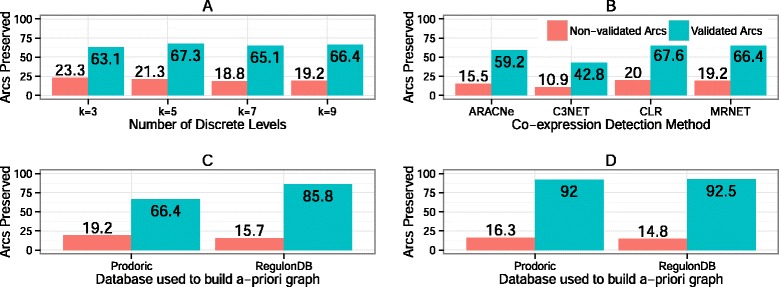
Fig. 7.

Comparisons of LOMBARDE performance with different input data. Different methods and parameters were used to generate the input E. coli data used by LOMBARDE. The percentage of arcs kept from the a priori graph in the output is shown in relation to the validated arcs in and the non-validated arcs in . a The costs of the arcs in the a priori graph were computed for four values of the parameter k. b The set was computed using four different methods to infer mutual information. c and d Two different databases were used to infer the set and thus the a priori graphs and , respectively, were generated
