Fig. 1.

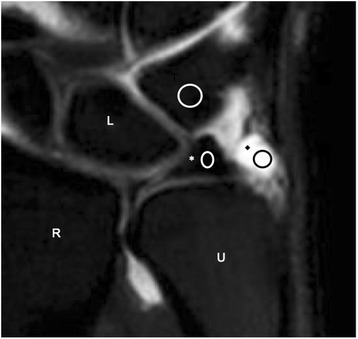
3 T 3D PDFS image with marks indicating region of interest (ROI) measurements used in quantitative analysis. Average signal intensity of the contents of the ellipse was measured (R-radius, U-ulna, *-TFCC disc, ♦-prestyloid recess)

3 T 3D PDFS image with marks indicating region of interest (ROI) measurements used in quantitative analysis. Average signal intensity of the contents of the ellipse was measured (R-radius, U-ulna, *-TFCC disc, ♦-prestyloid recess)