
Figure 4. Modeling Adipocyte Turnover.
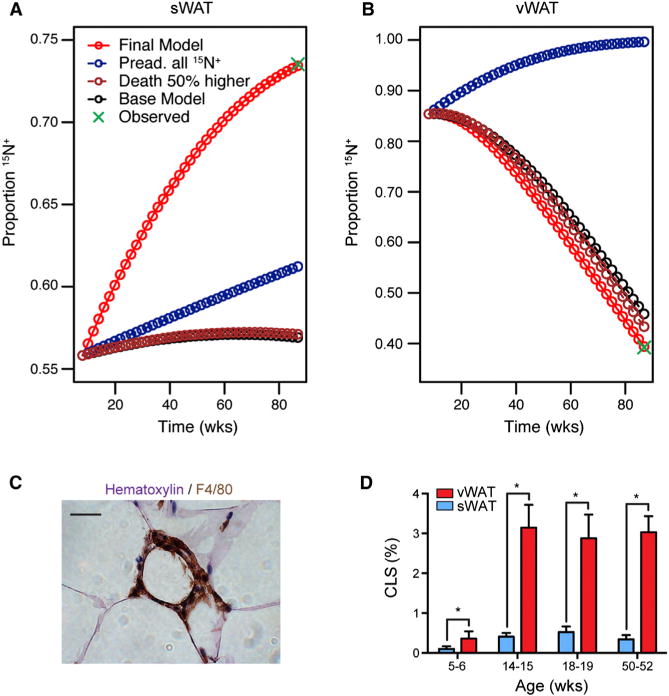
(A) Simulated models of sWAT adipocyte turnover. Increasing the adipocyte death rate (Death 50% higher) did not substantially improve the fit of the model. Even an assumption of 100% progenitor 15N-labeling at conclusion of pulse was insufficient to simulate the observed data. The data were best fit by the inclusion of progenitor differentiation without further division (Final Model).
(B) Modeling of vWAT adipocyte turnover.
(C) Representative “crown-like structure.” F4/80 staining macrophages surrounding a necrotic adipocyte. Scale bar represents 20 μm.
(D) Relative frequencies of “crown-like structures” in the sWAT and vWAT of C57BL/6 mice as a function of age (mean ± SEM; n = 3–7).
See also Figure S6, Table S1, and Supplemental Experimental Procedures.