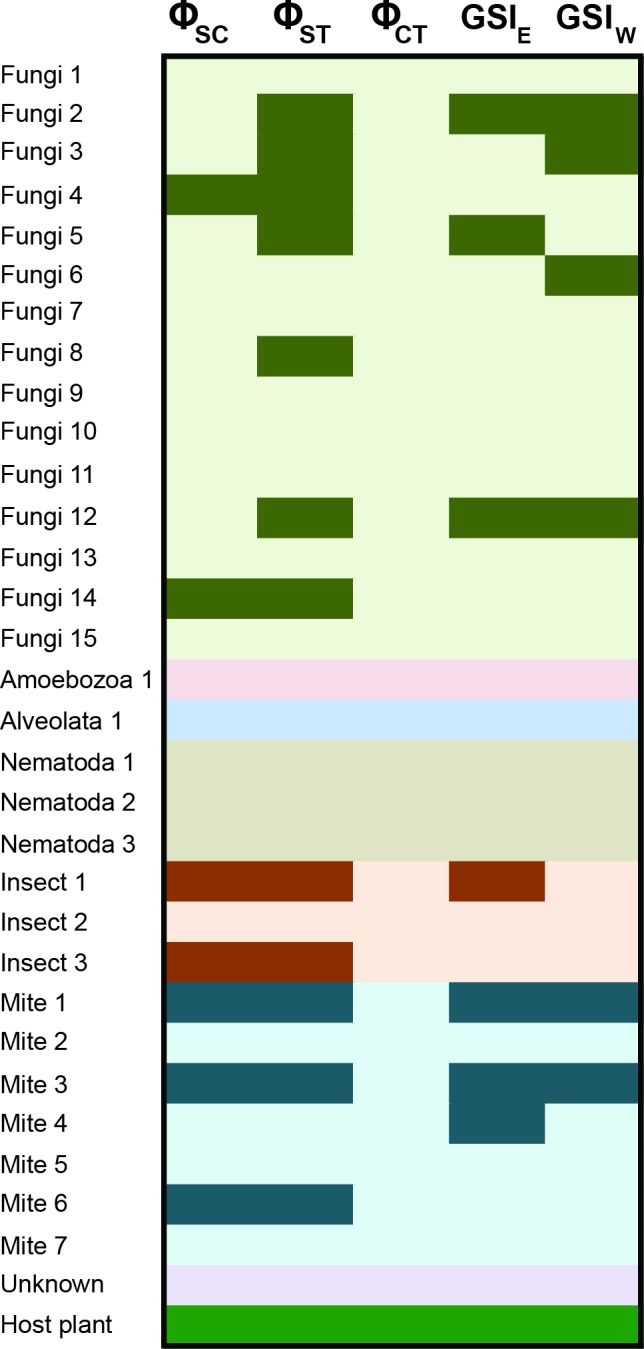
Figure 4. Population genetic structure for the inquiline community spanning the Mississippi River.

Results are shown from the AMOVA and GSI analyses. AMOVA analyses show the hierarchical partitioning scheme of locales within regions (ΦSC), locales within total distribution (ΦST), and between regions (ΦCT). GSI analyses represent the amount of allelic sorting on the eastern and western sides of the Mississippi River. Dark cells indicate taxa with significant genetic structure at the corresponding level; Table S2 contains specific values from each analysis. See Carstens & Satler (2013) for sampling information for S. alata, as these samples were collected from throughout the plant’s distribution.
