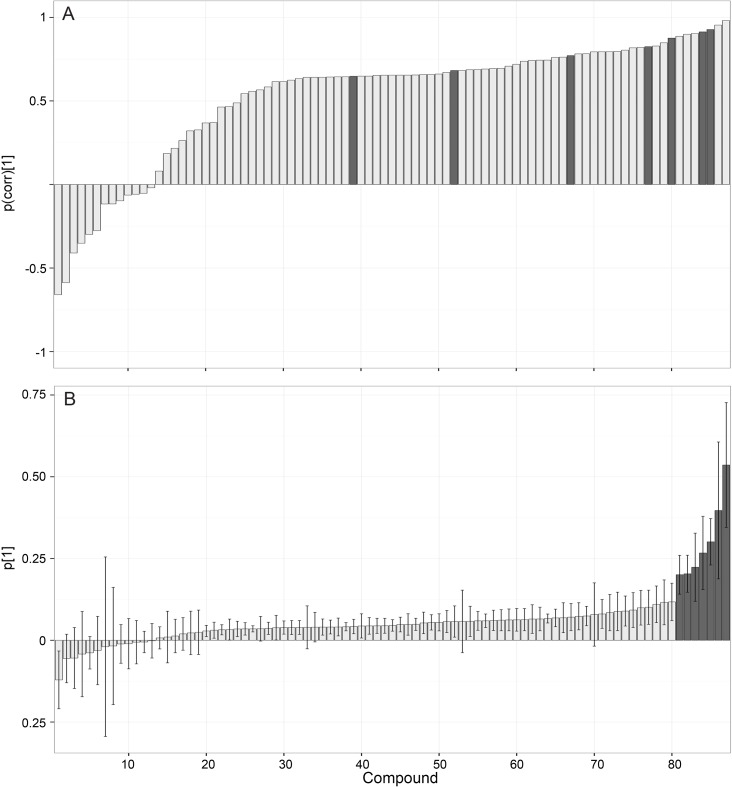
Figure 4. Differences between male and female exudates compound by compound.
The OPLS-DA loading plots of metabolites exuded from female and male copepods. The loading plot (A) represents the effect and reliability (correlation, p(corr)[1]), and (B) the contribution or magnitude (covariance, p[1]) of each metabolite to class separation. Jack-knifed confidence intervals (95%) in the covariance plot (B) were calculated from cross-validation. Metabolites with high p(corr)[1] and p[1] values are shaded.

