
Figure 5.
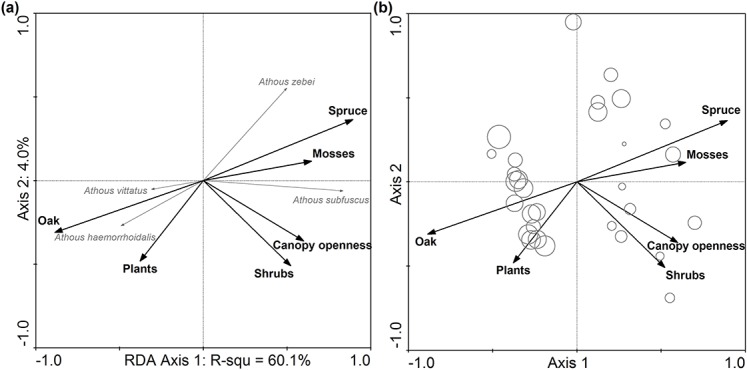
(A) Species-environmental biplot at 20 meters radius as derived from redundancy analyses (RDA) on species composition of soil-dwelling click beetles showing the response of species to environmental variables of the forest patch in the lowland plantation forest area. (B) Shannon diversity based data attribute-environmental biplot showing the diversity of samples. Note that in (A), the response of the species corresponded to the right angle projection of the end of the species arrow to the arrow of the particular studied predictor. The variance explained by each environmental variable and its P values is in Table 3. The size of the bubbles in (B) corresponds to the diversity of particular sample.