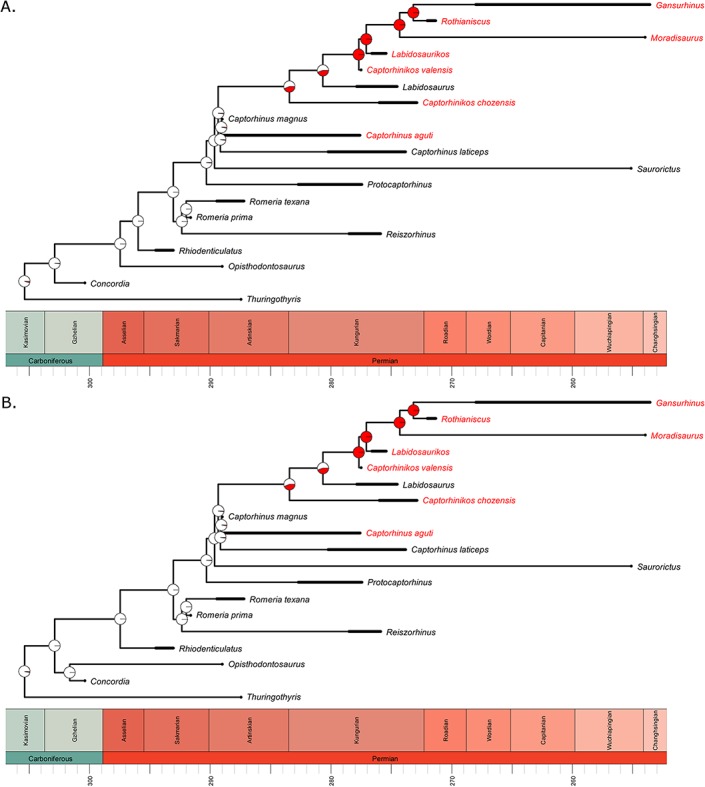
Figure 6. The evolution of multiple tooth rows in the Captorhinidae.

Two of the 100 time calibrated phylogenies used in this analysis. The tip labels in red indicate those taxa with multiple tooth rows. The pie charts represent the probability of an ancestral morphology including multiple tooth rows, deduced by maximum likelihood ancestral state reconstruction using the ace function in the R package ape. (A) MPT 1. (B) MPT 2.
