
Figure 1. NMR Order Parameters Reproduction.
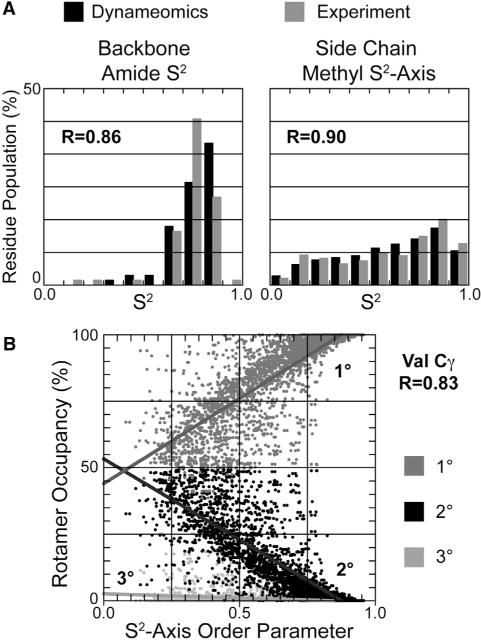
(A) Histogram of order parameters comparing experiment and calculated values from Dynameomics simulations. Correlation coefficients between experiment and simulation are inset.
(B) Example of the relationship between rotamer occupancy and order parameter for the primary, secondary, and tertiary rotamers of Val Cγ methyl groups.