
Figure 4. Topological Bias of Experimental Structures Used in Rotamer Library Creation.
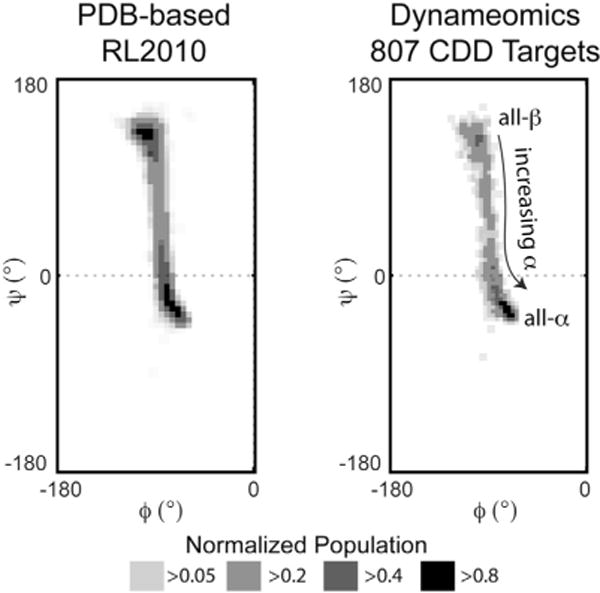
Proteomic Ramachandran plot histograms of the PDB structures used in both the RL2010 and Dynameomics rotamer libraries showing the distribution of proteins in terms of their average ϕ/ψ angles. As the coverage of ϕ/ψ space by L-amino acid-containing proteins is essentially constrained to negative values, only the left halves of the plots are shown.