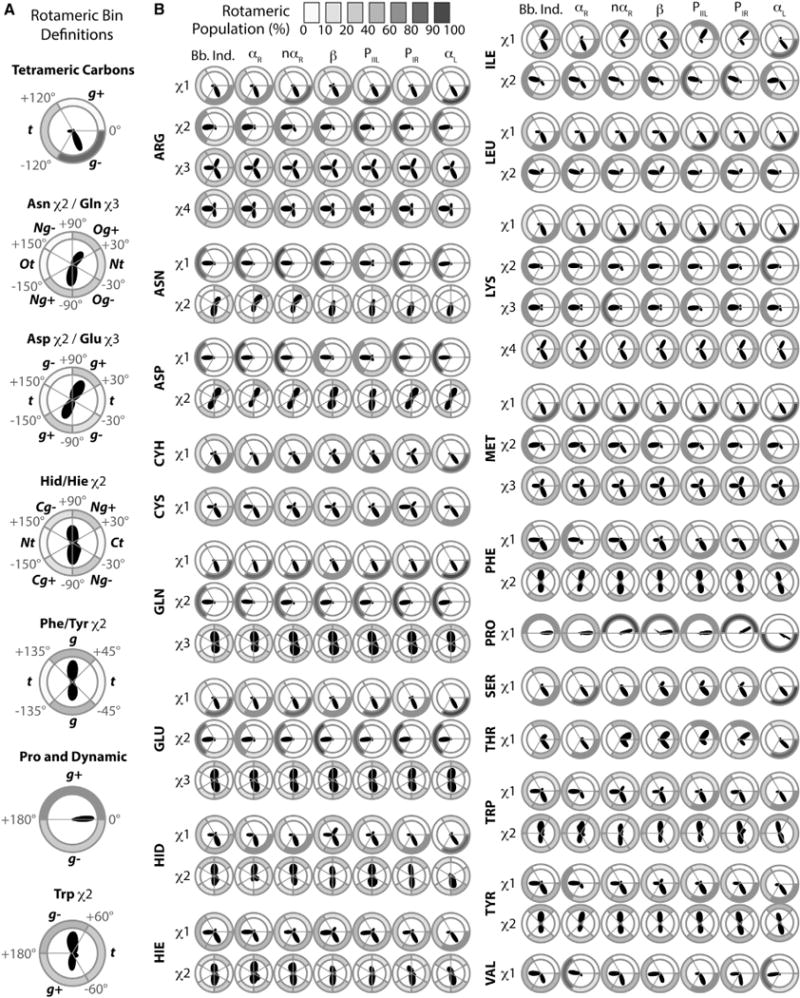
Figure 7. Rotameric Bin Definitions and Dihedral Angle Distributions.

(A) Dihedral angle ranges that define rotameric states.
(B) Polar dihedral angle distributions and rotameric bin populations from trajectories of all residues within the Dynameomics dataset. For each amino acid and side-chain dihedral angle, the polar distribution of the angle is shown surrounded by donut plots shaded by population.
See also Table S2.
