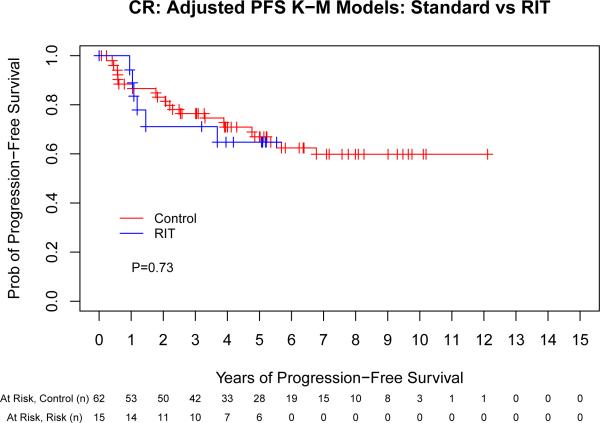
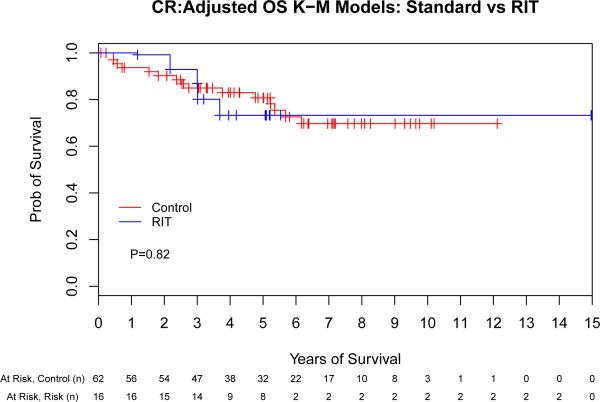
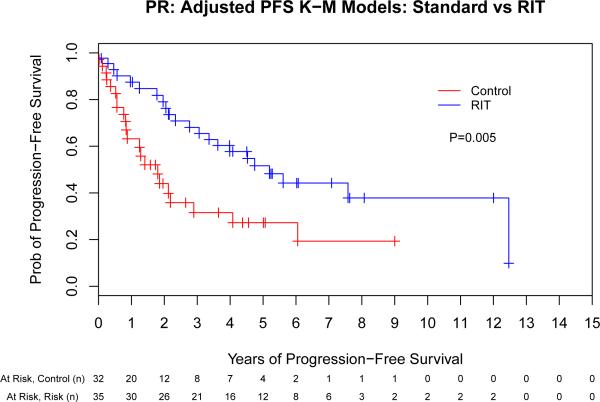
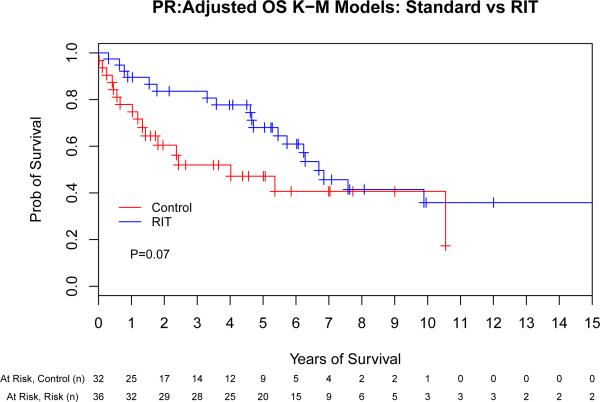
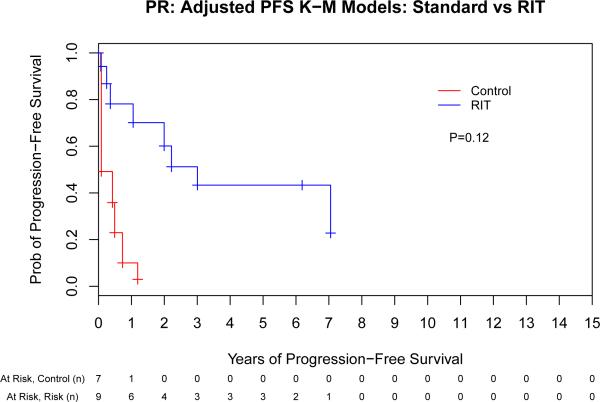
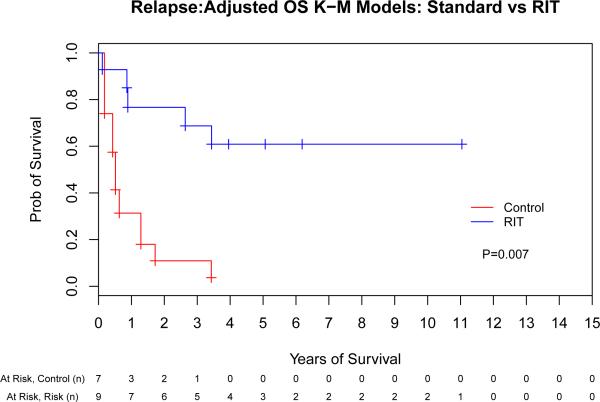
Fig 3.
The benefit of high-dose radioimmunotherapy increases as disease status worsens. Progression-free (A,C,E) and overall survival (B,D,F) for patients in complete remission (A,B), partial remission (C,D) or stable/progressive disease (E,F), depicted as Kaplan-Meier curves. The Control group acts as a reference while the radioimmunotherapy (RIT) group is adjusted via the important covariates. P-values are the results of Cox proportional hazard models. Tick marks represent censored events. Prob, probability.

