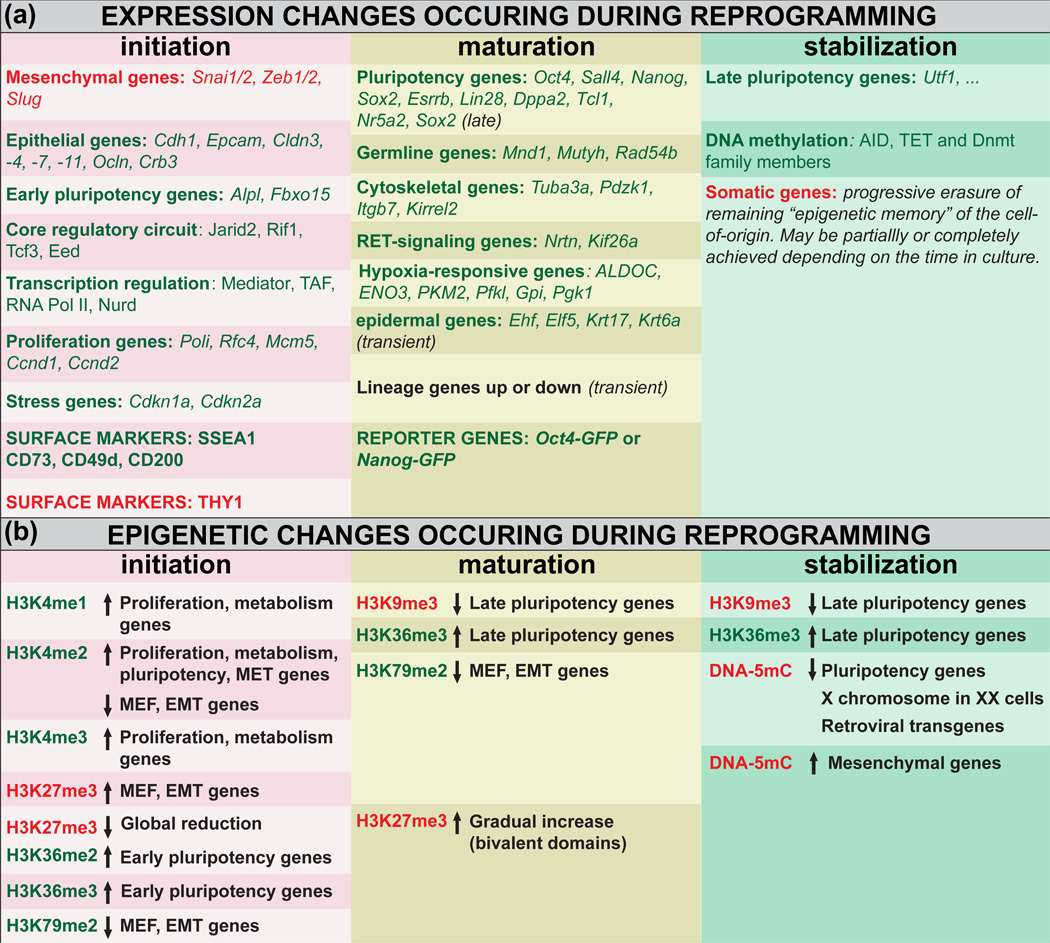
Table 2. Transcriptional and epigenetic changes during reprogramming.
(a) Expression changes (mRNA or protein). Genes in green are up-regulated and genes in red are down-regulated. (b) Epigenetic changes. Marks in green are generally associated with active loci and marks in red are generally associated with repressed loci. Arrows pointing up or down indicate respectively an increase or a decrease in the corresponding epigenetic mark. EMT, epithelial-to-mesenchymal transition; MEF, mouse embryonic fibroblast; MET, mesenchymal-to-epithelial transition. H3, histone H3; K4, K9, K27, K36, K79, Lysines 4, 9, 27, 36 and 79 of histone H3; me1, me2, me3, mono-, di- or tri-methylated respectively; DNA-5mC, 5-methyl cytosine DNA methylation.

