Figure 10.

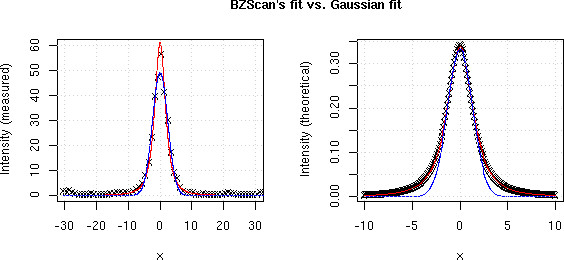
Signal fitting Comparison between BZScan's fit FPSL (red line), a Gaussian fit (blue line) and measured data (crosses on left plot) or theoretical data computed using ΦPSL (crosses on right plot).

Signal fitting Comparison between BZScan's fit FPSL (red line), a Gaussian fit (blue line) and measured data (crosses on left plot) or theoretical data computed using ΦPSL (crosses on right plot).