
Figure 10.
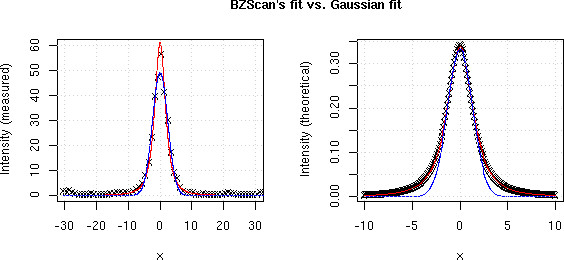
Signal fitting Comparison between BZScan's fit FPSL (red line), a Gaussian fit (blue line) and measured data (crosses on left plot) or theoretical data computed using ΦPSL (crosses on right plot).
Official websites use .gov
A
.gov website belongs to an official
government organization in the United States.
Secure .gov websites use HTTPS
A lock (
) or https:// means you've safely
connected to the .gov website. Share sensitive
information only on official, secure websites.
Signal fitting Comparison between BZScan's fit FPSL (red line), a Gaussian fit (blue line) and measured data (crosses on left plot) or theoretical data computed using ΦPSL (crosses on right plot).