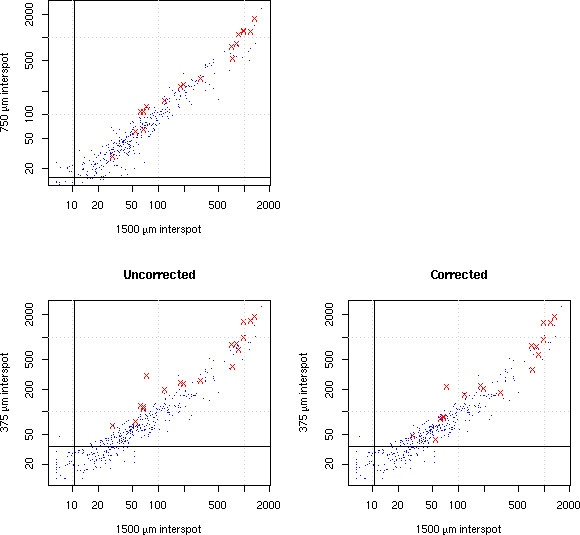
Figure 7.

Overshining correction. The same spotting pattern at three different densities: 375 μm, 750 μm, and 1500 μm inter-spot distance. Comparison of the 375 μm pattern with the 1500 μm one shows a larger dispersion than the 750 μm/1500 μm comparison: this is the overshining effect. The red points are the spots detected as significantly affected by overshining in the 375 μm density. Applying a correction computed via the fit reduces the dispersion. Black lines indicate background levels.
