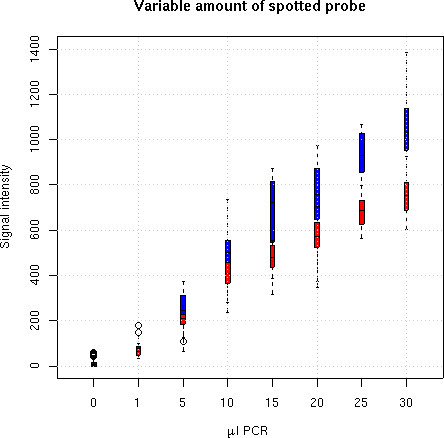
Figure 8.

Effect of probe dilution. Variable dilutions of spotted material (dots are medians, bars are inter-quartiles). Using the fit (1) (blue) improves the positive correlation between the measured intensity and the spotted probe amount compared to traditional image (pixel value) quantification (red).
