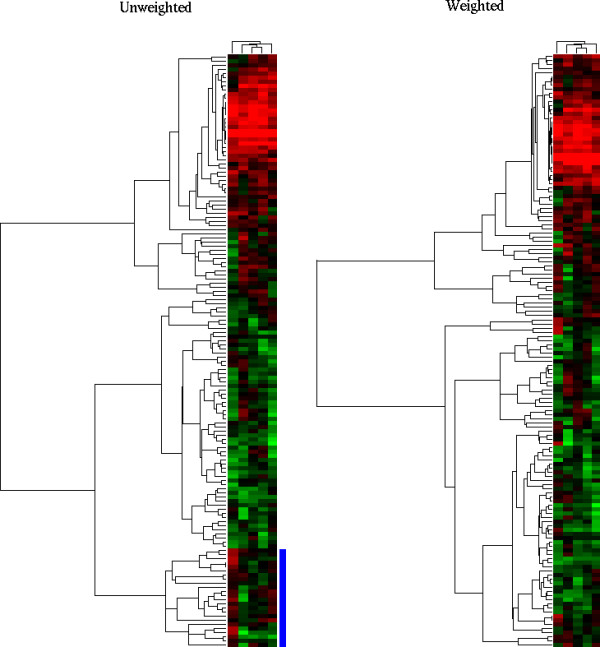
Figure 9.

QM and clustering weights. Unweighted clustering (left) compared with weighted clustering (right), with weights defined as columns and row medians of QM. The data correspond to five different exposure of the same cDNA hybridisation. The leftmost array (the noisiest one, 8 h exposure) has a lesser influence on the determination of the clusters on the right-hand side, and these clusters appear more coherent. Note that samples (columns) are sorted in the same order on both clusterings.
