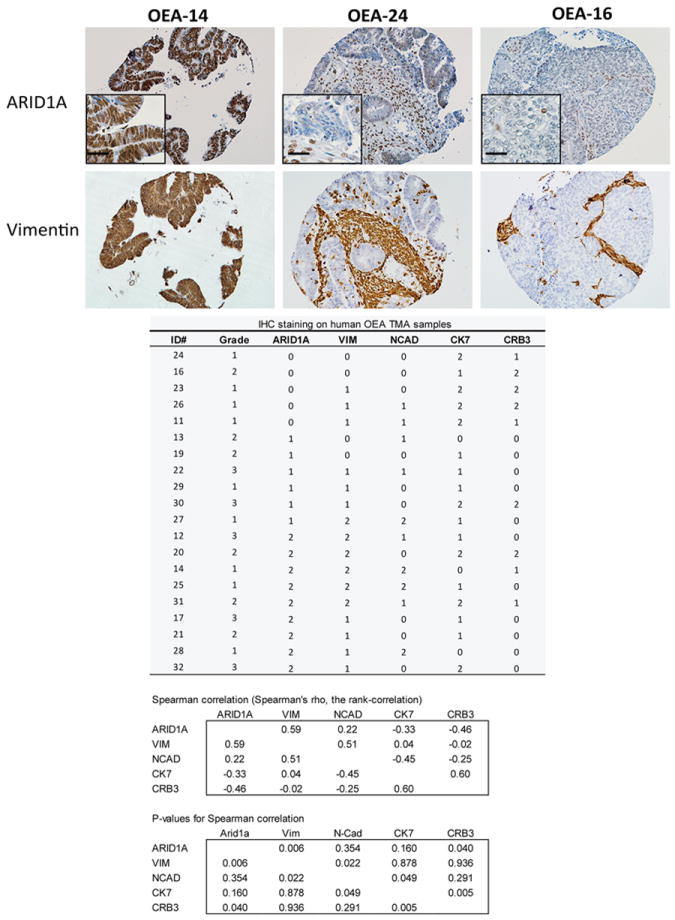
Figure 3. Expression of ARID1A and vimentin are inversely correlated in human OECs.

Photomicrographs of IHC staining for ARID1A and vimentin in representative OECs in a human ovarian cancer tissue microarray. FIGO grade and IHC score for each tumor and antibody and statistical analysis are also shown.
