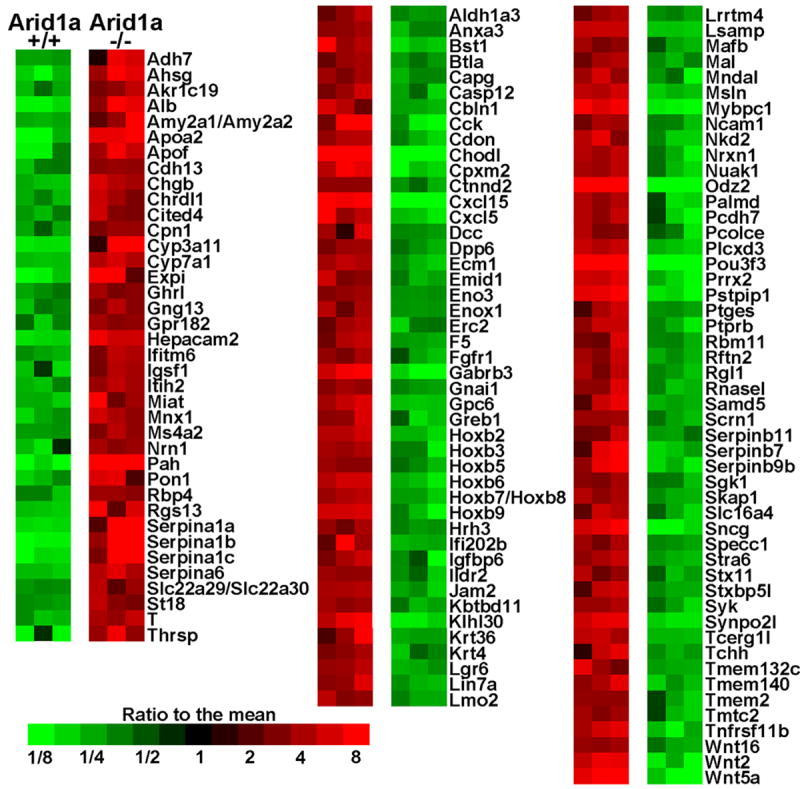
Figure 4. Differential gene expression in OECs with and without knockout of Arid1a.

Heatmap shows genes with at least 10-fold average differences in gene expression and p<.01 by two-sample T-test. Only probe-sets with well-annotated genes are shown, and where several probe-sets for the same gene qualified, the one with the smallest p-value is shown.
