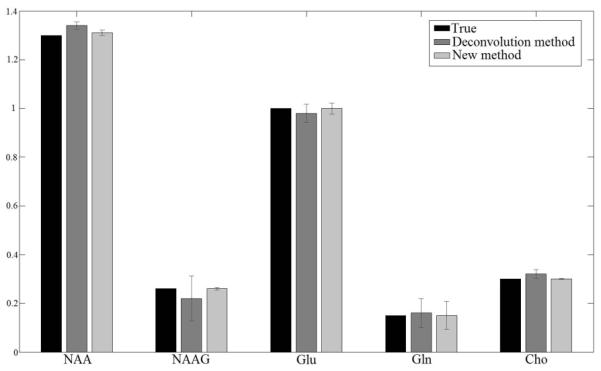
Figure 2.

Mean and standard deviation of metabolite/Cr concentration ratios from 100 simulations with different noise realizations. Black, dark gray and light gray bars represent ground truth concentrations, simulations from regularized unsuppressed water method and the proposed method, respectively. Maximum quantification error for the water method is 14.31% and for the proposed method is 2.67%. The exact concentration numbers are provided in Table 1 of supplemental information.
