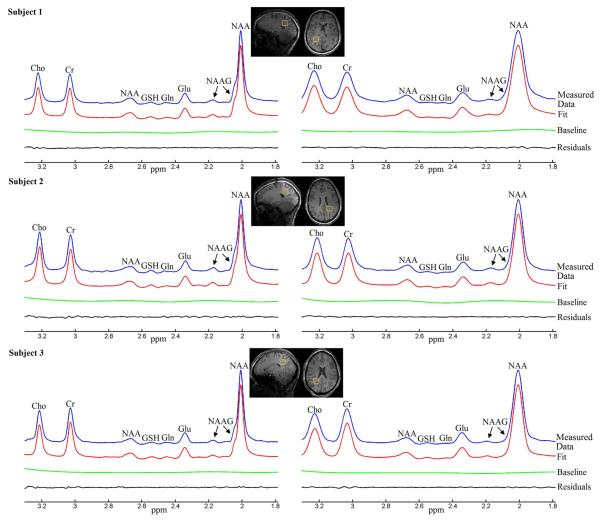
Figure 6.
Linear combination fitting plots from homogeneous field acquisition (left panels) and inhomogeneous field acquisition (right panels) of three healthy volunteers (different rows). The two acquisitions of each individual subject are from the same voxel located in the occipital lobe, indicated by the yellow boxes on the sagittal and axial T1-weighted images.

