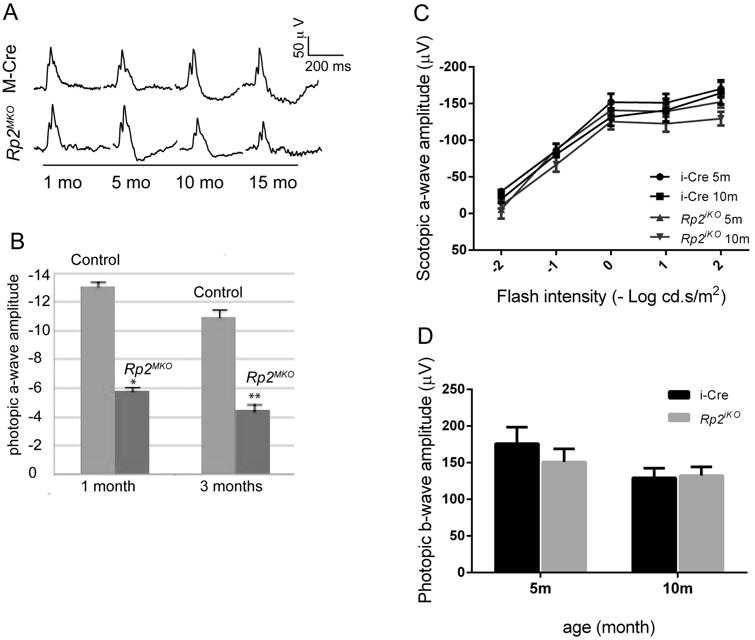
Figure 2.

A and B. Photopic ERG analysis represented as wave forms (A) and quantitative analysis (B) of the a-wave amplitude of the Rp2MKO mice at indicated ages as compared to control M-Cre mice show a progressive decline in cone function. *: p<0.05; **: p<0.01. C, D show the scotopic (C) ERG and photopic (D) ERG recordings of the Rp2iko and control mice. All data represent analysis of 6 mice of each genotype.
