Fig. 5.
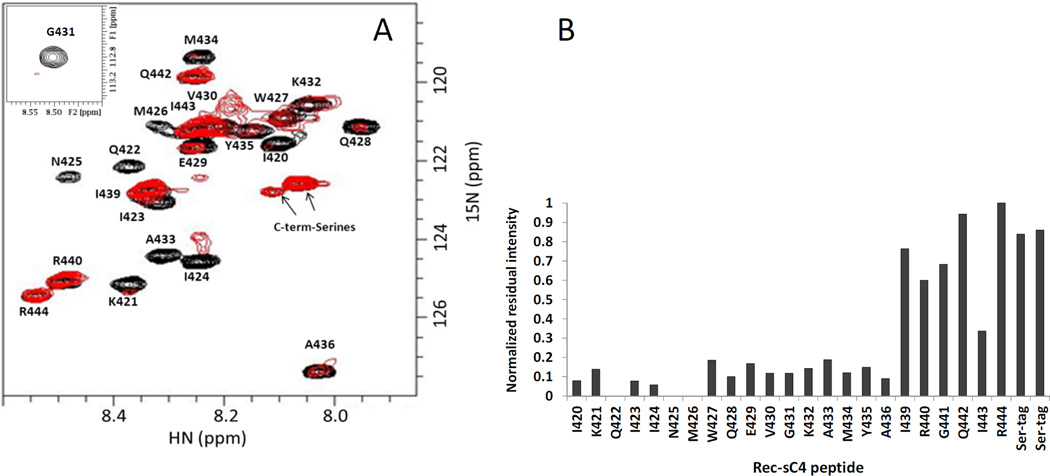
Mapping the C4 segments interacting with NN-T20-NITN. (A) An overlay of the 1H-15N-HSQC spectrum of U-15N-rec-sC4 in the presence of 1:1.15 molar ratio of NN-T20-NITN (red) and the spectrum of free 15N-labeled rec-sC4 (black). (B) Normalized residual intensity for each residue in the rec-sC4 upon addition of a 15% molar excess of T20. The normalized intensity was calculated by dividing the intensity of a specific 1H-15N cross peak of rec-sC4 in the presence of NN-T20-NITN by the intensity of the same residue in the spectrum of free rec-sC4. The residue that exhibited the highest ratio was then used to normalize all relative intensities Rec-SC4 concentration was 45 µM at 288 K, 50 mM D11-Tris-HCl, pH 7.0.

