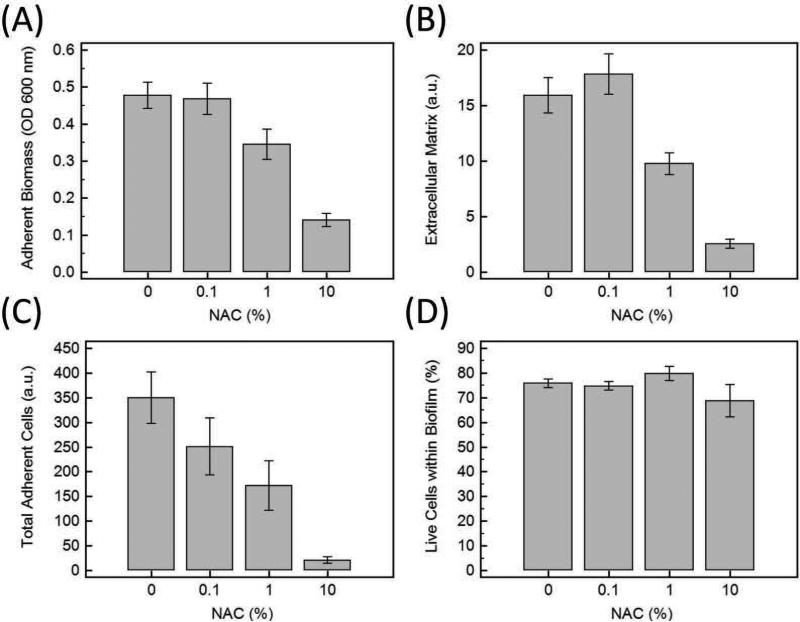
Figure 1.
A) Adherent Biomass on HA disks measured by crystal violet assay and the absorbance of the dye at 600 nm. B) Quantifying Extracellular Matrix with FilmTracer™ SYPRO® Ruby biofilm matrix stain at the excitation/emission (450 nm/610 nm). C) Quantifying total adherent bacteria (Live plus dead cells) using SYTO®9 and propidium iodide (PI). D) Although NAC caused a decrease in the amount of biofilm, the percentage of live bacteria within the biofilm was nearly unchanged with increased NAC concentrations. Error bars are 95% confidence intervals for the means (n=24 for each condition).

