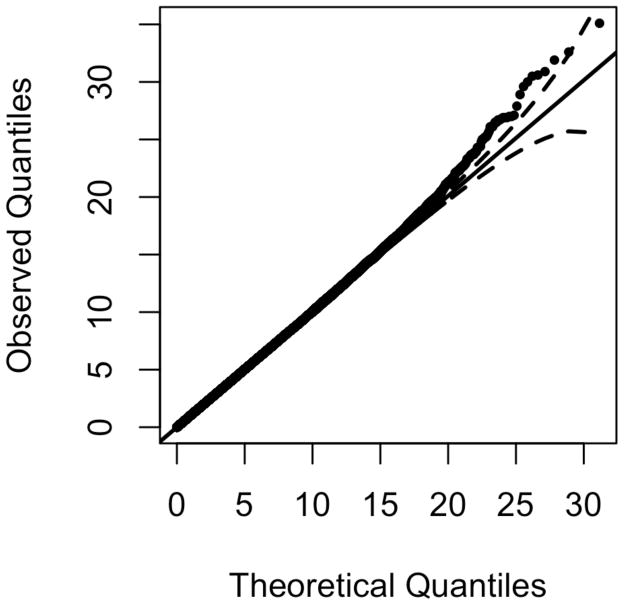
Figure 10. Q-Q plot for score test of the SAFHS data.
Results from the three degrees of freedom test for NIMA or offspring effects (β10, β.1, β.2) using the score test adjusting for age and sex (λ = 1.012). Data from the SAFHS consist of 635,494 SNPs from 419 offspring with HDL measurements in 43 multi-generational families.

