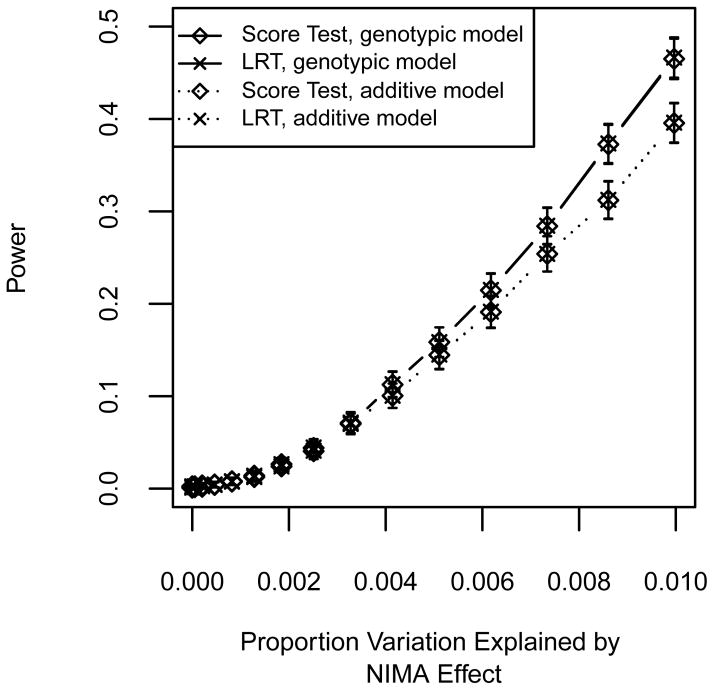
Figure 8. Power using an offspring effect only test for data simulated under a NIMA effect.
Curves show power using the LRT and score test at significance level α = 0.001. NIMA effect sizes range from 0 to 0.7. Solid lines show the power for fitting the genotypic model, i.e., the two degrees of freedom test for offspring effects (β.1, β.2). Dotted lines show the power for fitting the additive model, i.e., the one degree of freedom test with the added constraint 2β.1 = β.2. Error bars represent approximate 95% confidence intervals.

