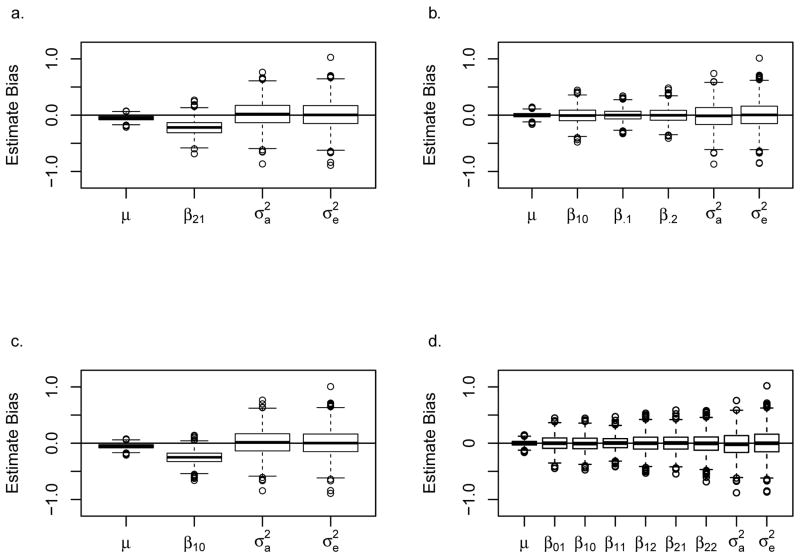
Figure 9. Parameter estimate bias due to model misspecification.
Genotypes and quantitative traits for each replication were simulated for 1,000 pedigrees using Simulation J data with an offspring allelic effect of 0.27 (μ = 40, β.1 = 0.27, β.2= 0.54, ). Boxplot shows bias of parameter estimates, additive variance, and environmental variance over 2,000 replications when the model is misspecified as (a) Model 2, the RHD effect model, (b) Model 3, the NIMA and offspring effects model, (c) Model 5, the NIMA effect model, and (d) Model 8, the general model. A horizontal line is drawn at zero bias.

