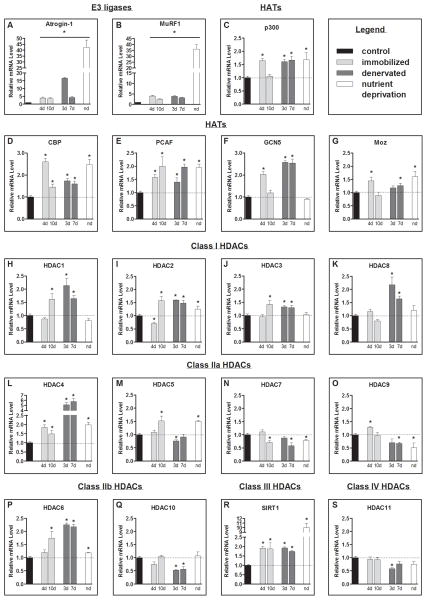
Figure 1.
Atrophy gene expression profile. Relative mRNA levels of; the E3 ligases (A) atrogin-1 (Mm_026346.3/Rn_133521.1) and (B) MuRF1 (Mm_001039048.2/Rn_080903.1), the HATs: (C) p300 (E1A binding protein p300; Mm_177821.6/Rn_576312.4), (D) Cbp (CREB (cAMP-responsive element binding protein)-binding protein; Mm_001025432.1/Rn_133381.3), (E) Pcaf (P300/CBP-associated factor; Mm_001177798.1/Rn_001107442.1), (F) Gcn5 (general control of amino-acid synthesis; Mm_029090.3/Rn_001107050.1), and (G) Moz (Monocytic leukemia zinc-finger protein; Mm_001081149.1/Rn_001100570.1); the class I Hdacs: (H–K) Hdac1 (Mm_008228.2/Rn_001025409.1), Hdac2 (Mm_008229.2/Rn_053447.1), Hdac3 (Mm_010411.2/Rn_053448.1), and Hdac8 (Mm_027382.3/Rn_001126373.2), class IIa Hdacs: (L–O) Hdac4 (Mm_207225.1/Rn_343629.4), Hdac5 (Mm_001077696/Rn_053450.1), Hdac7 (Mm_001204275.1/Rn_345868.4), Hdac9 (Mm_024124.3/Rn_001200045.1), class IIb Hdacs: (P& Q) Hdac6 (Mm_001130416.1/Rn_228753.5) and Hdac10 (Mm_199198.2/Rn_001035000.1), the class III Hdac: (R) Sirt1 (Mm_001159589.1/Rn_001080493.1) and the class IV Hdac: (S) Hdac11 (Mm_144919.2/Rn_001106610.2) from the soleus muscle of control and 4 day (4d) and 10 day (10d) immobilized mice, tibialis anterior (TA) muscle of control and 3 day (3d) and 7 day (7d) denervated rats, and nutrient deprived (nd) mice. All values were normalized to 18s. Bars represent means ± SE for 6 muscles/group. *P<0.05 vs control.

