
Figure 3.
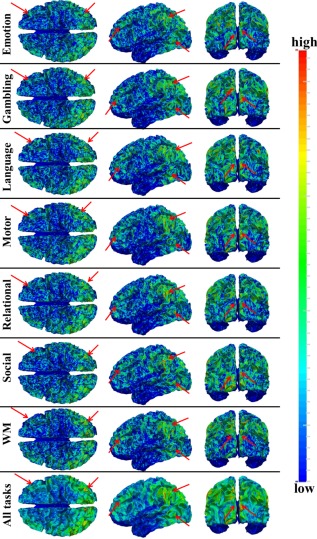
Distribution density map of identified THFRs across all subjects in each of the seven tfMRI data. Those THFRs with higher distribution density and relatively consistent across seven tasks are highlighted by red arrows. [Color figure can be viewed in the online issue, which is available at http://wileyonlinelibrary.com.]