
Figure 6.
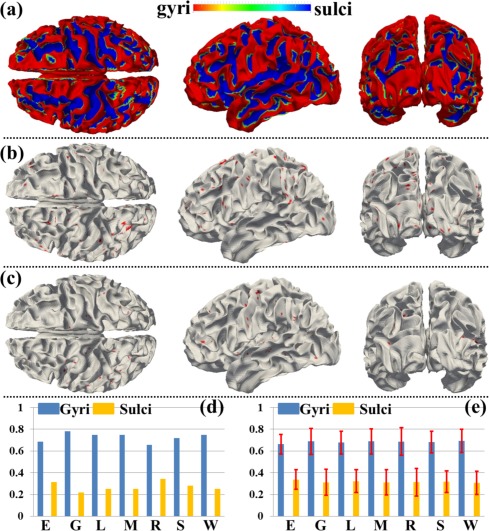
Spatial patterns of THFRs in single task on gyri/sulci and the percentages of involved grayordinates in THFRs in single task on gyri/sulci. (a) Segmented gyri and sulci of one example subject. (b) and (c) Spatial patterns of THFRs (red) on gyri (b) and sulci (c) in emotion task data of the example subject, respectively. (d) Percentages of involved grayordinates in THFRs on gyri/sulci in the example subject in all seven tasks. (e) Mean percentages of involved grayordinates in THFRs on gyri/sulci across all subjects in all seven tasks (E: emotion; G: gambling; L: language; M: motor; R: relational; S: social; W: working memory). [Color figure can be viewed in the online issue, which is available at http://wileyonlinelibrary.com.]