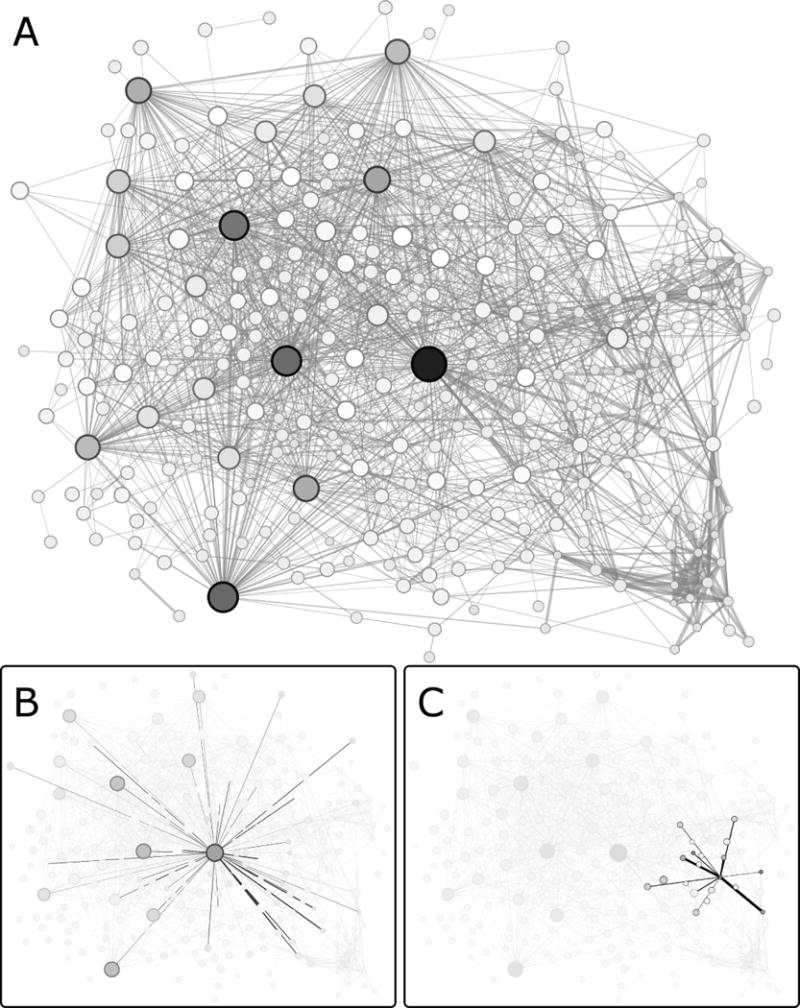
Fig. 1. Network representation of co-evolutionary scores for the LacI/GalR family.

Note that these networks depict co-evolutionary scores, not structural contacts. (A) In this example, the ZNMI algorithm was used to calculate pairwise co-evolution scores. High scores are represented as thick edges; weak scores are represented with thin edges. Each node corresponds to an MSA column (amino acid position); node sizes and colors are scaled according to EVC scores (large, black = high, small, white = low). For figure clarity, only the top ~4% of edges are shown; however, all edge weights (co-evolution scores) were used for EVC calculations. From the network shown in A, individual nodes and their edges are highlighted in panels (B) and (C), to illustrate the difference between a top EVC position with many moderate scores (B) and a position with a high, pairwise co-evolution score but a low EVC score (C).
