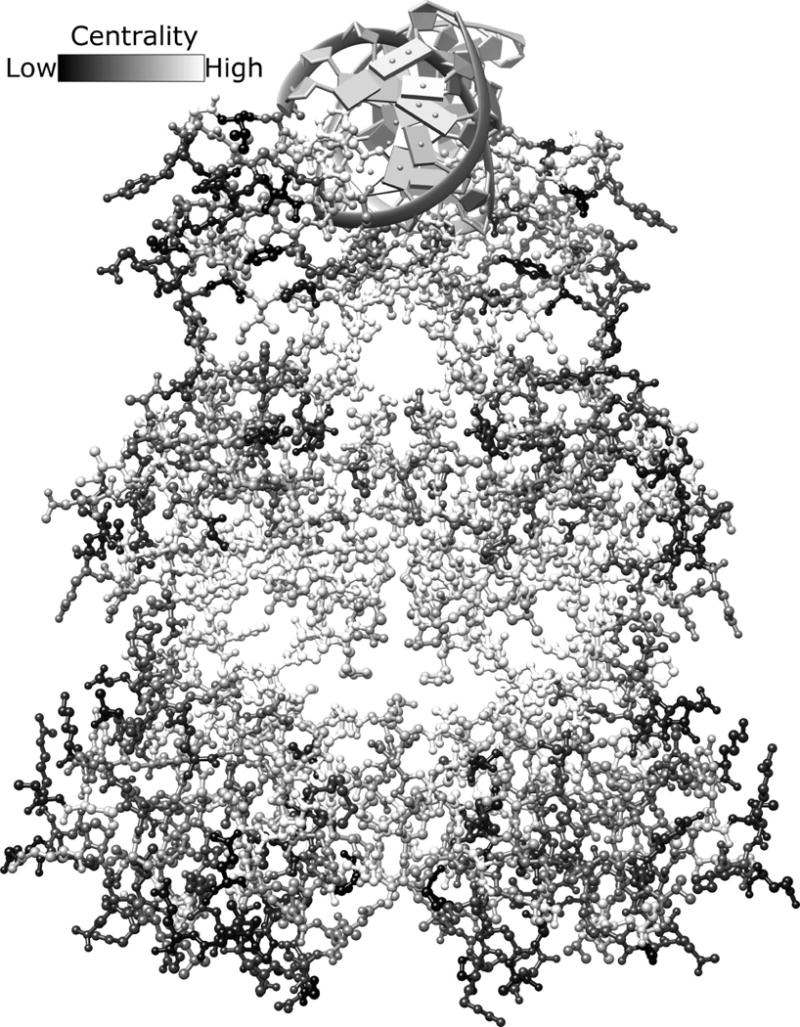
Fig. 5. Global structural analysis LacI/GalR EVC scores.

The homodimeric structure of LacI (PDB: 1efa53) is color-coded based on the rank order of each positions’ EVC score (high scores, white; low scores black). Bound DNA is shown at the top of the figure in gray. Inducer ligands bind in the central pocket of each monomer. Given the range of available scores (color bar at the top of the figure), it is striking that some structural regions are dominated by similar scores. For example, the inducer binding site is surrounded by positions with high EVC scores (very light gray and white). This figure is shown in color in Fig. S16.
