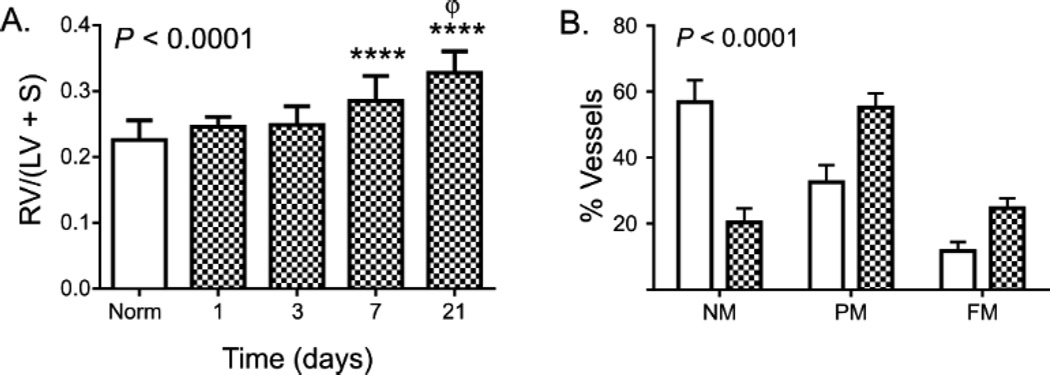
Figure 1. Chronic hypoxia induces progressive RVH.
In (A), RVH is measured as the ratio of RV mass to LV + septum mass at each time point. Mean and standard deviation are shown at each time point, with normoxic data pooled from all experiments. Replicate numbers as outlined in Table 1. P value is for ANOVA; **** = P < 0.0001 between CH and control, Φ = P < 0.01 between 21 days and 7 days (corrected for multiple comparisons). In (B), the proportion of small pulmonary vessels (< 100 µm) that are non- (NM), partially- (PM), or fully-muscularized (FM) are shown in mice exposed to normoxia or chronic hypoxia for 1 week. At least 340 vessels were counted per treatment condition. P value is for differences among groups via χ2.

