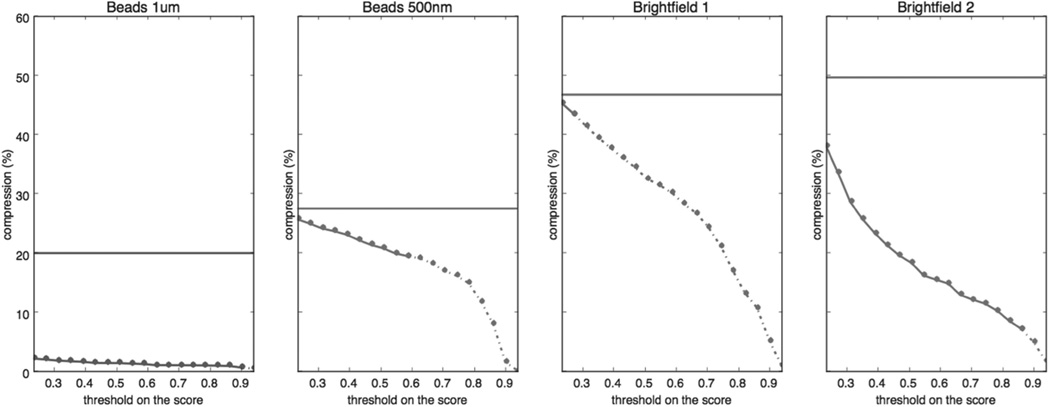
Fig. 3.
Plots of compression ratio (in percentage) vs. correlation magnitude threshold on scores for four
videos. Four plots shows the result for four test videos. Four plots share the same vertical axis. A horizontal flat line indicates the compression ratio on that video with H.264 lossless. The curves become dashed when the analysis results on compressed videos differs from the analysis result on the original, indicating the limit compression without impacting analysis results.results.
45×15mm (600 × 600 DPI)

