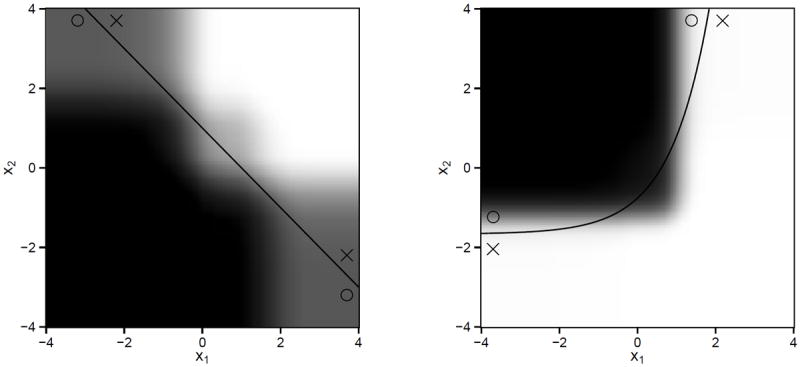
Figure 3.

Left: average estimated regimes under setting II. Right: average estimated regimes under setting III. In both settings πopt cannot be represented as decision list. The solid line is the treatment decision boundary under πopt. The region where treatment 1 is better than treatment 2 is marked by circles, while the region where treatment 2 is better than treatment 1 is marked by crosses. For every point (x1, x2)T, we compute the proportion of 1000 replications that the estimated regime recommends treatment 1 to a patient with covariate (x1, x2, 0, …, 0) ∈ ℝ10. The larger the proportion, the darker the shade.
