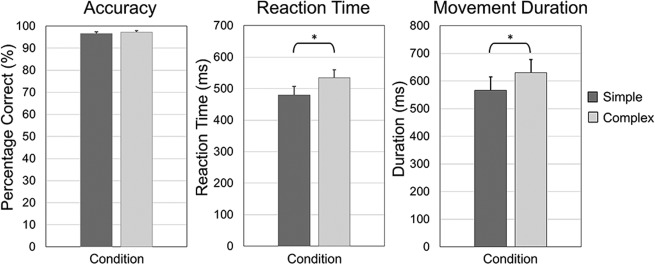
Figure 2.

Behavioral results. In each bar graph, the simple condition is shown in dark gray, while the complex condition is shown in light gray. Error bars denote the standard error of the mean (SEM). Accuracy (percentage correct) is shown in the left panel. Participants performed generally well, and there was no significant difference in accuracy between the conditions, t(16) = 0.940, P = 0.361. Reaction time (in ms) is shown in the center panel. Participants had significantly slower reaction time in the complex compared to the simple condition, t(16) = 5.45, P < 0.001. The right panel shows mean movement durations for each condition. There was a significant increase in movement duration in the complex compared to the simple condition, t(16) = 4.27, P < 0.001. To control for these behavioral differences in the MEG analyses, we synced our MEG data with movement onset in each trial and focused all analyses on the time windows preceding and during the early stages of movement execution (i.e., before movement termination).
