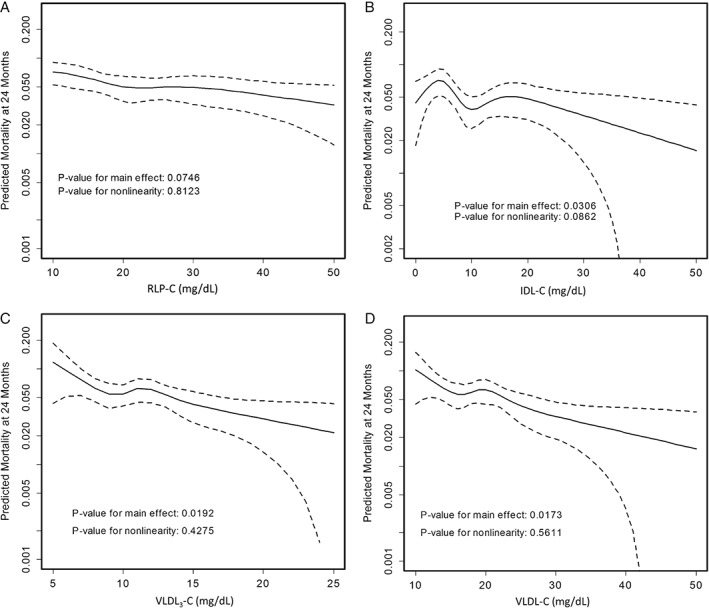
Figure 1.

Adjusted spline curves of RLP‐C parameters in association with predicted mortality. Restricted cubic spline curves are presented. The x‐axis represents observed values for RLP‐C parameters and the y‐axis represents predicted mortality (log scale) at 2 years in TRIUMPH after adjusting for all covariates in the fully adjusted model 3 (covariates listed in methods). Dotted lines indicate the 95% CI. Illustrated are (A) RLP‐C, (B) IDL‐C, (C) VLDL3‐C, and (D) VLDL‐C. Results were consistent across models 1, 2, and 3; therefore, results from only model 3 are highlighted. Abbreviations: CI, confidence interval; IDL‐C, intermediate‐density lipoprotein cholesterol; RLP‐C, remnant lipoprotein cholesterol; TRIUMPH, Translational Research Investigating Underlying Disparities in Acute Myocardial Infarction Patients' Health Status; VLDL‐C, very‐low‐density lipoprotein cholesterol; VLDL3‐C, very‐low‐density lipoprotein cholesterol subfraction 3.
