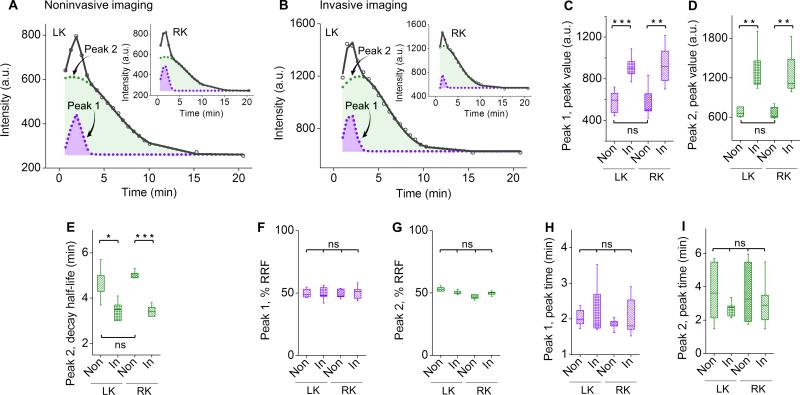
Figure 3.
Quantitative comparison of noninvasive and invasive kidney imaging with GS-AuNPs. (A,B) Representative time-fluorescence intensity curves (TFICs) of kidneys obtained from noninvasive (A) and invasive (B) imaging of the same mouse after GS-AuNPs injection (0-20 min). The curves (in black) can be deconvoluted to peak 1 and peak 2 (in purple and green, respectively). (C-I) Statistical analysis of peak parameters extracted from noninvasive (“Non”) and invasive (“In”) kidney TFICs. The parameters included peak value (C,D), decay half-life (E), percentage of relative renal function (% RRF; F,G) and peak time (H,I), which were used to evaluate kidney function in clinical practice. LK, left kidney, RK, right kidney, N = 6 for C-I, mean ± s.d., *P < 0.05, **P < 0.01, ***P < 0.001; ns, no significant difference.

