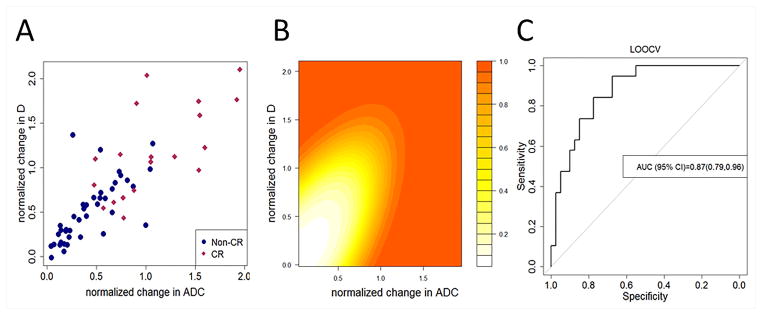
Fig. 3.
(A) shows a scatterplot depicting mid-therapy changes in ΔADC and ΔD for patients experiencing presence/absence of complete response (CR). (B) shows a Contour plot depicting the posterior probability of observing complete response as a function of mid-therapy changes in ΔADC and ΔD obtained from analysis using Bayesian QDA. (C) shows a Receiver operating characteristics curve obtained from the Bayesian model for predicting complete response using mid-therapy changes in ΔADC and ΔD using leave-one-out cross-validation. Combined the parameters attained an AUC=0.87 (95% CI: 0.79, 0.96) with sensitivity=0.63, specificity=0.85, and accuracy=0.78.

