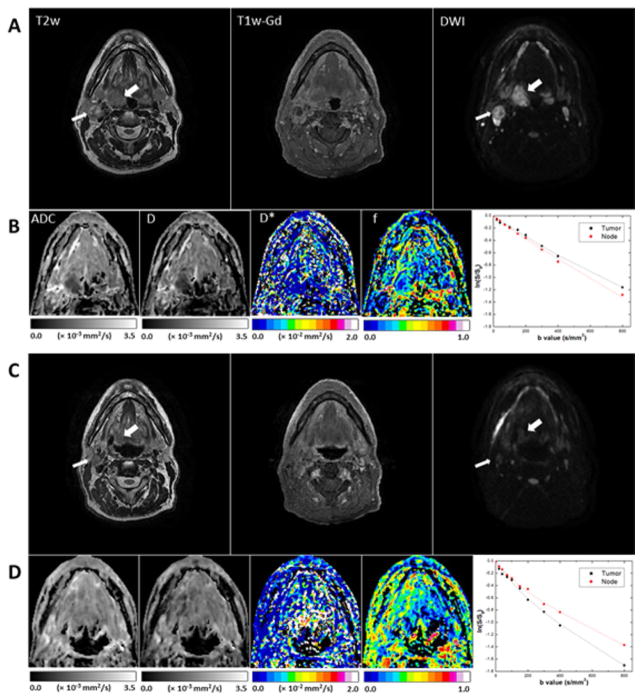
Fig. 5.
Representative MR images of a tumor (right tonsil; thick arrows) that had a midtreatment CR and a lymph node metastasis (thin arrows) that had a midtreatment PR (patient 5, a 60-year-old man). (A, B) Pretreatment scans; (C, D) midtreatment scans. The T2w, T1w-Gd, and DWI (b = 800 mm/s2) images (A, C) were windowed to have similar image contrast, whereas ADC and IVIM parameter maps (B, D) were scaled according to the scale bars shown below the images (the scales used for midtreatment images were the same as those used for preatment images). Logarithmic plots of biexponential signal decay in the primary tumor and nodal metastasis are shown on the right in panels B and D.

