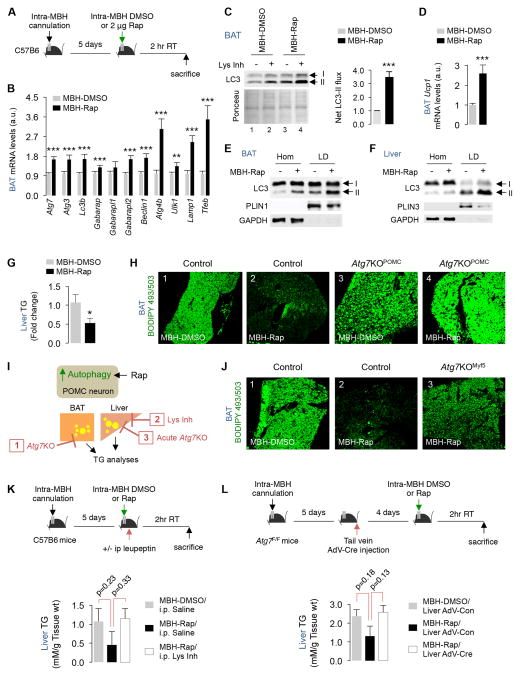
Fig. 5. Stimulating hypothalamic autophagy activates lipophagy in BAT/liver.
(A) Plan for mediobasal hypothalamus (MBH) cannulation and intra-MBH injections of DMSO or rapamycin (Rap) for 2 hr at RT. (B) qPCR of indicated genes, (C) Immunoblot (IB) for LC3 in presence or absence of lysosomal inhibitor (Lys Inh), (D) Ucp1 expression, and (E–F) IB for indicated proteins in Hom/LD fractions from indicated tissues from intra-MBH DMSO or Rap treated mice. (5 BAT pads pooled per sample per experiment, n=2). (G) Liver triglycerides, and (H) BODIPY 493/503 staining in BAT from intra-MBH DMSO or Rap-injected 6 mo male control and Atg7KOPOMC mice, n=5. (I) Plan for blocking autophagy (Atg7KO) or lysosomal function (Lys Inh) in BAT or liver followed by intra-MBH administration of DMSO or Rap. (J) BODIPY staining in BAT from intra-MBH DMSO and Rap-injected 4 mo male control or Atg7KOMyf5 mice, n=4. (K) Plan and analyses of liver triglycerides in mice pretreated or not with Lys Inh i.p. for 2 hr or (L) subjected to tail vein AdV-Con or AdV-Cre injections to deplete Atg7 and then exposed to intra-MBH DMSO or Rap, n=4. Bars are mean±s.e.m. *P<0.05, **P<0.01, ***P<0.001; Student’s t-test. Ponceau is loading control. See also Figure S5.

