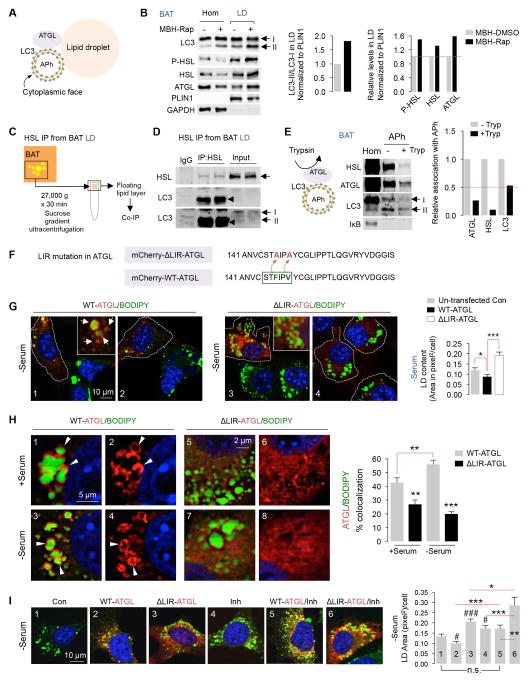
Fig. 7. LIR motifs on ATGL regulate lipolysis.
(A) Autophagosomes (APh) facilitate localization of ATGL to LD. (B) Immunoblots (IB) for indicated proteins in BAT homogenates (Hom) and LD from intra-MBH DMSO or Rap-injected mice. Quantifications for LC3-II/LC3-I and indicated proteins in LD normalized to PLIN1 are shown (5 BAT pads pooled per sample per experiment, n=2). BAT Hom/LD samples in Fig 5E and Fig 7B originate from the same experiment. (C) Plan for co-immunoprecipitation (IP) from LD fractions. (D) Co-IP of HSL and IB for indicated proteins in BAT LD from RT-housed control mice, n=2. Duplicate samples are shown. Two different LC3 exposures are shown. (E) APh from BAT pooled from 3 cold-exposed mice subjected to LC3 trypsin protection assay, and IB for indicated proteins in Hom and APh fractions, n=2. (F) Point mutations (F147A, V150A) to inactivate LIR motif on ATGL (ΔLIR-ATGL). (G) Direct fluorescence (DF) for mCherry/BODIPY 493/503 in 6 hr (0.25 mM) oleic acid (OA)-treated NIH3T3 cells expressing mCherry-WT-ATGL or ΔLIR-ATGL in absence of serum for 6 hr. White arrows indicate ATGL/BODIPY association. Dotted lines outline transfected cells. (H) DF for mCherry/BODIPY in 6 hr OA-treated NIH3T3 cells expressing mCherry-WT-ATGL or ΔLIR-ATGL in presence/absence of serum for 6 hr. White arrowheads indicate ATGL/BODIPY association. (I) DF for mCherry/BODIPY in 6 hr serum-starved NIH3T3 cells expressing mCherry-WT-ATGL or ΔLIR-ATGL treated with OA −/+ lysosomal inhibitors (Inh) for 6 hr. At least 40 cells analyzed from n=3. Bars: mean±s.e.m. *P<0.05, **P<0.01, ***P<0.001, (#P<0.05, ###P<0.001 compared to panel 1 in F); Student’s t-test. See also Figure S6.

