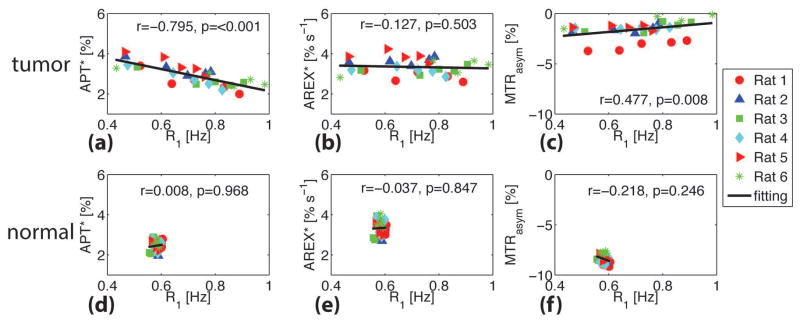
Figure 6.
Correlations of tumor APT* (a), AREX* (b), and MTRasym (c) with R1 for six rats. The corresponding correlations for the contralateral normal brain tissues are shown in (d), (e), and (f). The Spearman’s coefficient r and p values are provided for each correlation. The full lines represent the linear regression of all data points in each subfigure.

