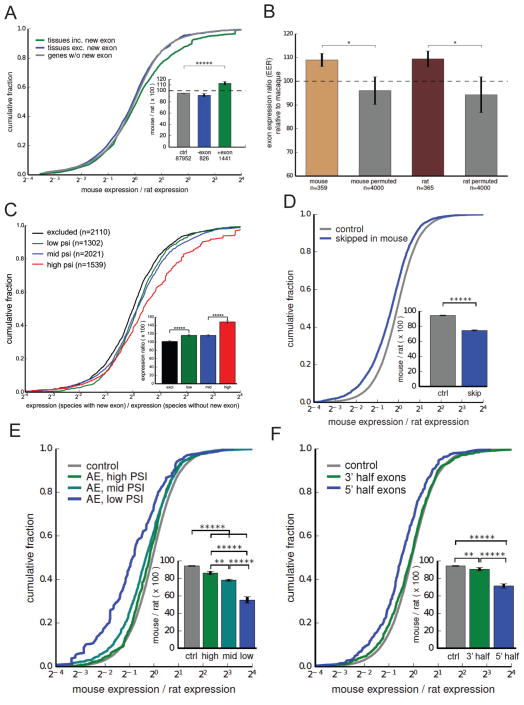
Figure 5. Inclusion of new exons is associated with increased species-specific gene expression changes.
Throughout the figure, statistical significance by Mann-Whitney U test is indicated by asterisks (* P < 0.05, ** P < 0.01, *** P < 0.001, **** P < 0.0001, ***** P < 0.00001).
(A) Fold change in gene expression between mouse and rat. Inset: mean ± SEM of displayed distributions.
(B) Mean EEI values, calculated as the ratio of the mean gene expression in tissues where a novel exon is included to the mean expression in tissues where inclusion of the exon is not detected. This ratio is calculated in a related species with matched tissues, and the ratio of these two values is plotted (mean ± SEM).
(C) Fold change in gene expression of mouse- and rat-specific exons between species with new exons (mouse, rat) and aligned closest species without new exon (rat, mouse, respectively), binned by the PSI of the exon in the tissue.
(D) Fold change in gene expression between mouse and rat in genes where an ancestrally present exon has become skipped in mouse.
(E) Fold change in gene expression between mouse and rat in genes where an old exon has become skipped in mouse, binned by the PSI of the exon in the tissue.
(F) Fold change in gene expression between mouse and rat in genes where an old exon has become skipped in mouse, binned by location of the exon within the gene.
See also Figure S6.

