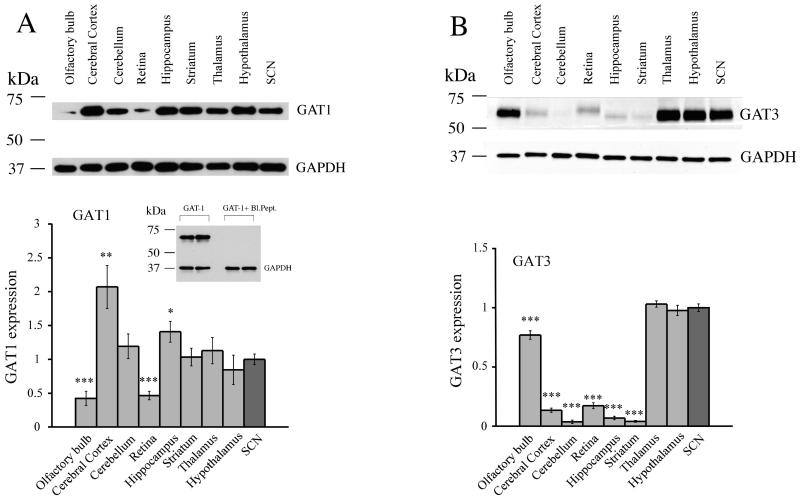
Figure 1. Relative expression levels of GAT1 and GAT3 in other brain regions compared to the SCN.
A and B: Western blot and quantitative analysis of GAT1 and GAT3 expression, respectively. Upper: immunoblot, GAT bands (top line), and the loading control: GAPDH (bottom line). Molecular mass markers (kDa) are indicated. Lower: optical density (O.D.) was measured and quantified with ImageJ software, then normalized to the loading control (shown in ratio units). Each bar represents the ratio of GAT expression in each brain region to the SCN level. Error bars represent the SEM, * p < 0.05, ** p < 0.01, *** p < 0.001 when compared with SCN. Each histogram represents O.D. measurements from 5 gels (mean ± SE). A. In insert: Blocking peptide (Bl. pept., Alomone Labs Ltd.) completely blocked GAT1 detection in the cerebral cortex sample (positive control). Anti-GAT1 antibody alone and anti-GAT1 antibody + blocking peptide (Bl. pept., Alomone Labs) are shown in duplicates. A detailed description of antibodies is in Table 1 and in Methods. These data demonstrate that GAT1 is more widely expressed in the brain than GAT3. In contrast to GAT1, the GAT3 expression is more prominent in the thalamus and hypothalamus including the SCN.

